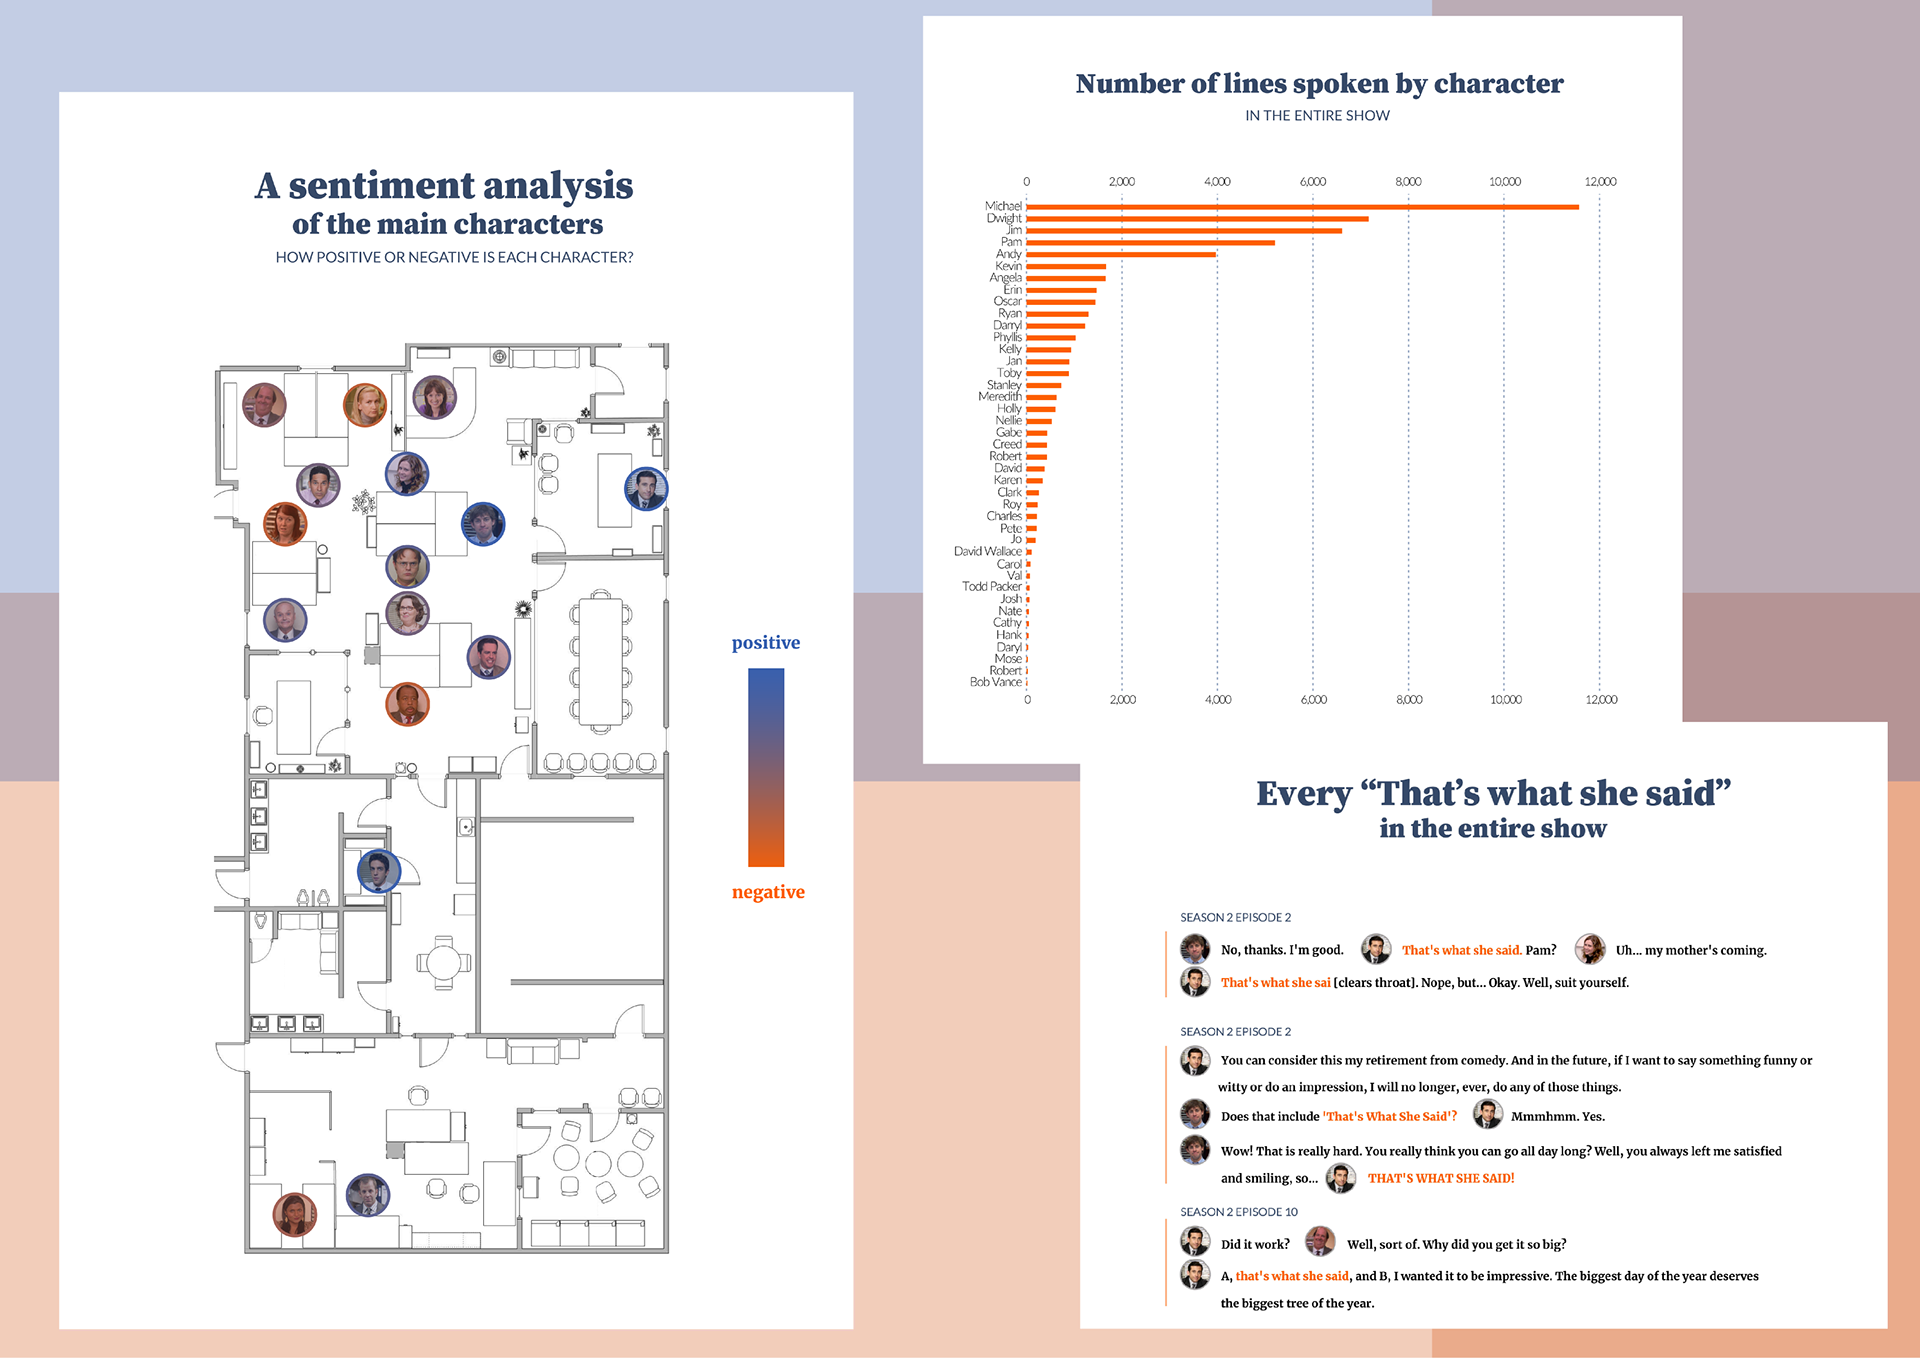
Fun data story about my favorite TV show: The Office. The text and sentiment analyses show who spoke the most in the show and which characters are the most negative and positive. The piece also includes a list of every "that's what she said" dialogue. Tools used: Python (pandas, TextBlob), matplotlib, Illustrator, HTML, CSS.